.jpg)
.jpg)
.jpg)
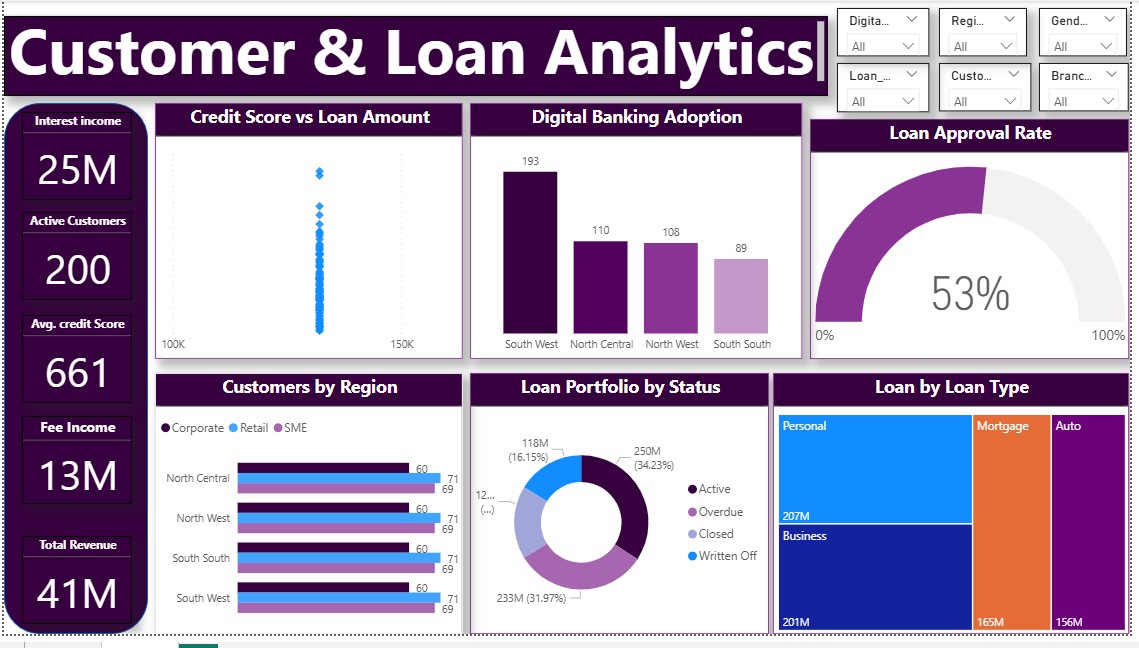
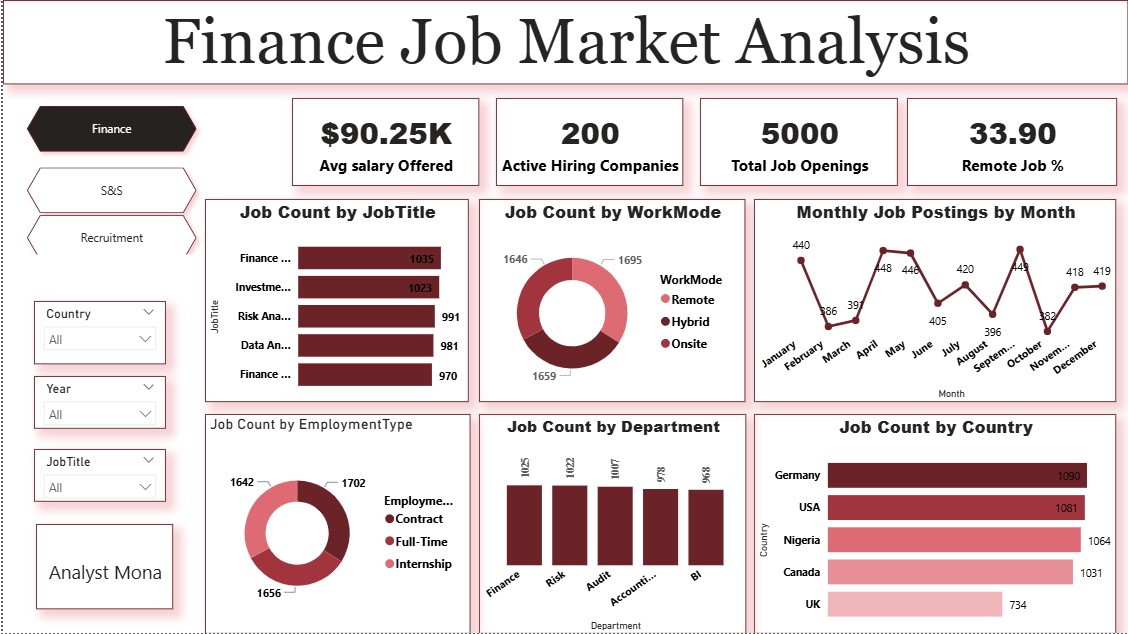
Dashboard Views Gallery (Data 1, 2 & 3)
1. Business Problem
An enterprise data management team needed a centralized 3-view Power BI portal to aggregate disparate operational data feeds into real-time executive summaries, diagnostic drilldowns, and predictive trend forecasts.
2. Project Objectives
- Develop a 3-page interactive Power BI suite summarizing operational volume, diagnostic KPIs, and forecast trends.
- Write advanced DAX measures for Rolling Averages, Percentage Contribution, and Target Variance.
- Design cross-filtering tooltips and dynamic parameter slicers.
3. Dataset Information
Enterprise analytics dataset comprising 150,000+ data log entries:
- Operational Data: Metric ID, Timestamp, Category, Region, Performance Value, Target Value.
- Dimensional Tables: Dim_Category, Dim_Region, Dim_Date.
4. Tools Used
Power BI Desktop
DAX Calculations
Power Query ETL
Data Operations
5. Data Cleaning & Transformation
Transformation steps executed in Power Query & DAX:
1. Cleansed outlier data points and unpivoted dynamic metric columns.
2. Formulated DAX Measure for Target Variance %:
Target Variance % = DIVIDE(SUM(Fact_Data[Performance_Value]) - SUM(Fact_Data[Target_Value]), SUM(Fact_Data[Target_Value]), 0)
6. Key Performance Indicators (KPIs)
150K+
Data Entries Ingested
98.2%
Data Pipeline Accuracy
3 Views
Multi-Page Architecture
7. Dashboard Interface Showcase (Data 1, 2 & 3)
Data View 1: Core Performance Overview
Data View 2: Operational Diagnostics
Data View 3: Predictive & Trend Analytics
8. Strategic Analytics Insights
Finding 1: Operational Efficiency Gain
Consolidating operational feeds into a 3-view Power BI dashboard reduced executive reporting turnaround time from 4 days to real-time.
9. Strategic Recommendations
- Automate scheduled daily Power BI Service dataset refreshes.
- Implement role-based security (RLS) to restrict regional data visibility per user role.
10. Technical Challenges
Optimizing DAX calculated measure performance across 150,000+ data rows was achieved by replacing calculated columns with measures.
11. Lessons Learned
Multi-page dashboard navigation combined with consistent color hierarchy provides non-technical users with seamless drillthrough analytical depth.
12. GitHub Repository
Open Source Power BI Templates
Inspect DAX measures and Star Schema layout on GitHub.
13. Downloads & Resources
14. Related Analytics Case Studies