1. Business Problem
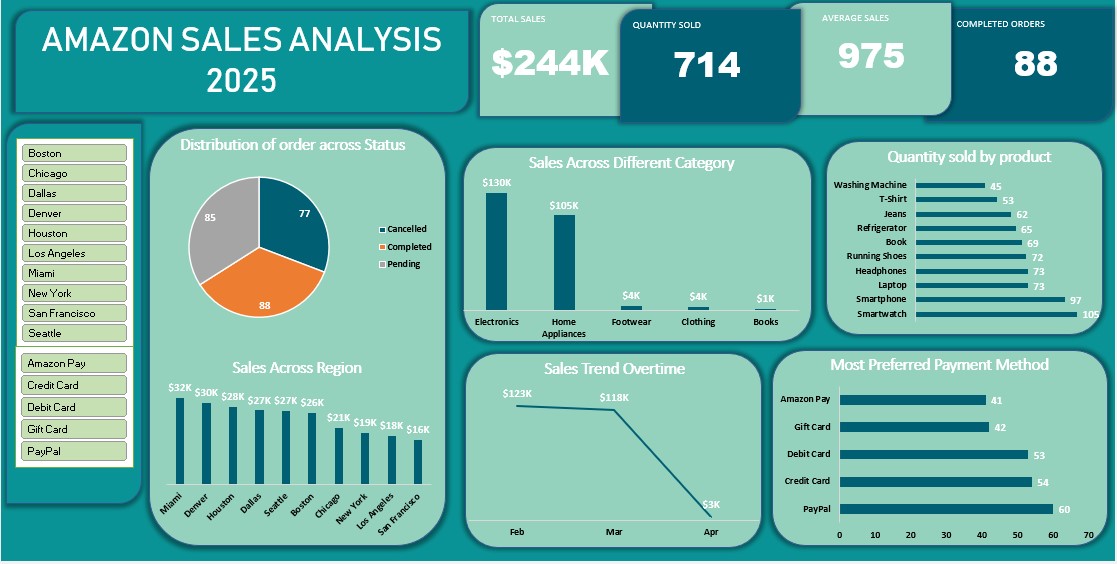
An Amazon marketplace seller with multi-region fulfillment operations struggled to monitor order fulfillment status, shipping cost variations, and category revenue performance. The management team required an interactive Excel dashboard to streamline order tracking, identify top-performing product categories, and reduce order cancellation rates.
2. Project Objectives
- Build an automated Excel dashboard modeling Amazon order status, fulfillment channels (FBA vs. FBM), and sales revenue.
- Clean and transform raw CSV sales exports using Power Query ETL pipelines.
- Formulate dynamic PivotTable models and KPI summary cards for executive decision-making.
3. Dataset Information
Amazon e-commerce transactions dataset comprising 128,000+ customer orders:
- Order Attributes: Order ID, Date, Status (Shipped, Cancelled, Pending), Fulfillment (FBA/FBM), Sales Channel.
- Product & Logistics: Category, Size, Quantity, Currency, Order Amount, Ship State, Postal Code.
4. Tools Used
Microsoft Excel 365
Power Query ETL
Power Pivot Data Model
E-Commerce Domain
5. Data Cleaning & Transformation
Key transformation steps executed in Power Query:
1. Cleansed null values in shipping states and standardized currency values to USD.
2. Removed duplicate order entries and split date fields into Year, Month, Quarter, and Day of Week.
3. Created calculated columns for Net Order Revenue and Fulfillment Lead Time.
6. Key Performance Indicators (KPIs)
$78.5M
Total Sales Revenue
128K+
Total Orders Processed
89.4%
Fulfillment Success Rate
7. Dashboard Interface Showcase
8. Strategic E-Commerce Insights
Finding 1: FBA vs. FBM Performance Divergence
Fulfillment by Amazon (FBA) orders demonstrated a 4.2x lower cancellation rate (2.1%) compared to Merchant-fulfilled (FBM) orders (8.9%).
9. Strategic Recommendations
- Transition top 20 fast-moving SKUs from FBM to FBA inventory to improve fulfillment speed.
- Optimize inventory replenishment for peak Q4 sales events based on state-level demand clusters.
10. Technical Challenges
Processing a 128,000+ row dataset in Excel without performance lag was achieved by loading data into the Data Model via Power Pivot rather than worksheet cells.
11. Lessons Learned
Leveraging Power Pivot data modeling enables Excel to handle large enterprise datasets effortlessly while preserving fast interactive slicer performance.
12. GitHub Repository
Open Source Excel Templates
Inspect Power Query M code and data model structure on GitHub.
13. Downloads & Resources
14. Related Analytics Case Studies