1. Business Problem
The Superstore retail enterprise experienced inconsistent profitability across different US geographical regions, shipping modes, and product sub-categories. Executive leadership lacked a centralized dashboard to identify which customer segments were generating high revenue versus those operating at negative margins due to excessive discounts.
2. Project Objectives
- Consolidate multi-year transaction data into an automated Excel analytics dashboard.
- Evaluate gross revenue, net profit, and profit margins across regional territories.
- Identify loss-making product sub-categories impacted by aggressive discount strategies.
- Build dynamic slicers allowing interactive drilldowns by Customer Segment and Shipping Mode.
3. Dataset Information
The dataset comprised 9,994 transaction records spanning 4 operational years with the following attributes:
- Order & Shipping Data: Order ID, Order Date, Ship Date, Ship Mode.
- Customer Demographics: Customer ID, Segment (Consumer, Corporate, Home Office).
- Geographic Metrics: Country, City, State, Postal Code, Region.
- Financial Indicators: Sales ($), Quantity, Discount (%), Profit ($).
4. Tools Used
Microsoft Excel 365
Power Query ETL
Power Pivot Data Model
DAX Measures
Retail Domain
5. Data Cleaning & Transformation
Using Excel Power Query, raw transaction logs were transformed and validated:
1. Imputed missing postal codes and standardized state string formatting.
2. Formatted Sales, Profit, and Discounts to standard currency and percentage types.
3. Engineered calculated column for Shipping Transit Time (Ship Date - Order Date).
4. Created a relational Data Model inside Power Pivot with a dedicated Calendar Table.
6. Key Performance Indicators (KPIs)
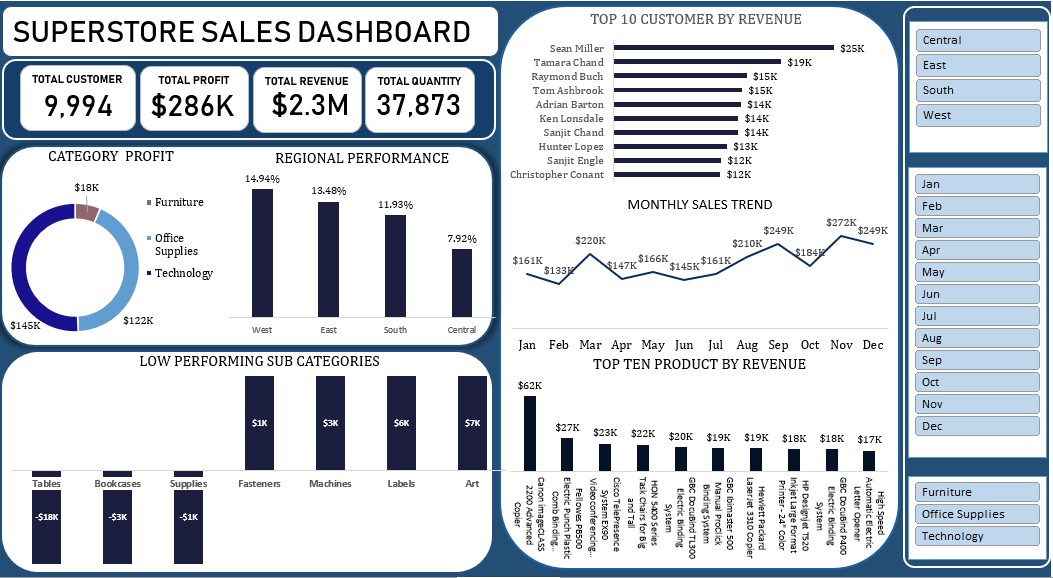
$2.30M
Total Sales Revenue
$286.4K
Total Net Profit
12.47%
Overall Profit Margin
7. Dashboard Interface Showcase
8. Strategic Business Insights
Finding 1: Discount Erosion
Discounts exceeding 20% severely eroded net profits in Tables and Bookcases sub-categories, resulting in a net negative profit margin (-16.4%) despite high transaction volume.
Finding 2: Regional Dominance
The West region generated the highest net profit ($108.4K) with an average order profit margin of 14.8%, driven by Technology and Copier sales.
9. Strategic Recommendations
- Cap promotional discounts at a maximum of 15% for Furniture and Office Supplies.
- Reallocate inventory fulfillment capacity toward top-performing West and East region hubs.
- Discontinue negative-margin Table SKUs with consistently high shipping delays.
10. Technical Challenges
Optimizing Excel workbook calculation speed with over 10,000 transaction rows and multiple PivotTables required establishing a Star Schema model in Power Pivot rather than relying on heavy VLOOKUP formulas.
11. Lessons Learned
Leveraging Power Query and DAX measures in Excel provides enterprise-level BI analytical power while keeping file sizes lightweight and user interfaces responsive.
12. GitHub Repository
Open Source Excel & Data Assets
View source data schema, M code scripts, and DAX measures on GitHub.
13. Downloads & Resources
14. Related Analytics Case Studies