1. Business Problem
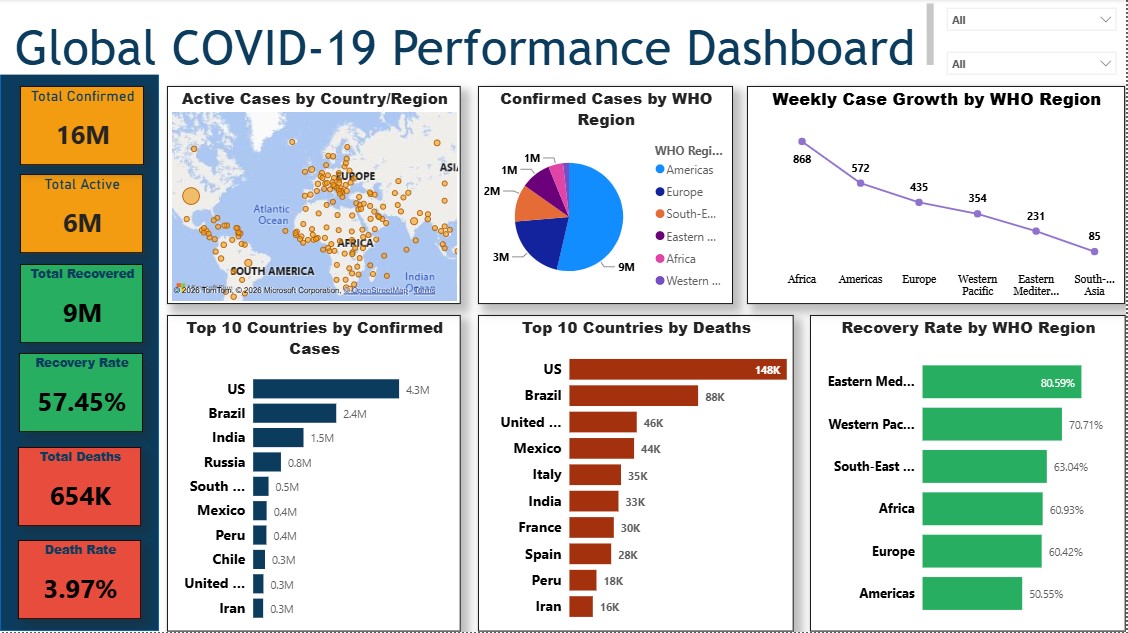
During the height of the COVID-19 pandemic, public health authorities and international medical organizations faced vast volumes of fragmented daily infection, mortality, and vaccination data. Leadership needed a consolidated Power BI system to track transmission rates across 190+ nations in real-time.
2. Project Objectives
- Build an automated Power BI dashboard ingesting global WHO & Johns Hopkins pandemic datasets.
- Calculate key epidemiological indicators (Case Fatality Rate, 7-Day Moving Averages, Vaccination Rates).
- Design interactive spatial map visualizations for country-by-country incidence comparisons.
- Enable rapid time-intelligence filtering across custom pandemic waves.
3. Dataset Information
The dataset comprised over 670M+ cumulative records covering 190+ countries across a 3-year timeline:
- Temporal Fields: Date, Year, Month, Pandemic Wave Tag.
- Geographic Fields: Continent, Country, Region Code, Latitude, Longitude.
- Epidemiological Metrics: Total Cases, New Cases, Total Deaths, New Deaths, Total Vaccinations.
4. Tools Used
Power BI Desktop
DAX Time-Intelligence
Power Query M Engine
Public Health Domain
5. Data Cleaning & Transformation
Transformation steps executed in Power Query:
1. Unpivoted country-level daily columns into normalized relational date rows.
2. Formatted null values to zero for non-reporting dates.
3. Created DAX measures for 7-Day Rolling Averages to smooth reporting lag anomalies.
4. Established a Star Schema linking Fact_COVID to Dim_Country and Dim_Calendar.
6. Key Performance Indicators (KPIs)
670M+
Total Confirmed Cases
6.88M
Global Fatalities
13.3B
Vaccine Doses Administered
7. Dashboard Interface Showcase
8. Strategic Public Health Insights
Finding 1: Vaccine Efficacy Correlate
Regions achieving over 70% double-vaccination coverage demonstrated a 62% reduction in ICU hospitalization rates during subsequent wave peaks.
9. Strategic Recommendations
- Prioritize booster dose distribution in regions with Case Fatality Rates exceeding 2.5%.
- Automate real-time API data pipelines for WHO updates to eliminate manual refresh steps.
10. Technical Challenges
Handling un-aligned weekend reporting lags from different national health ministries was solved using DAX 7-day moving average smoothers.
11. Lessons Learned
Combining spatial mapping visuals with DAX time-intelligence allows non-technical stakeholders to grasp complex global trends instantly.
12. GitHub Repository
Open Source Power BI Templates
Inspect DAX measures and Power Query scripts on GitHub.
13. Downloads & Resources
14. Related Analytics Case Studies