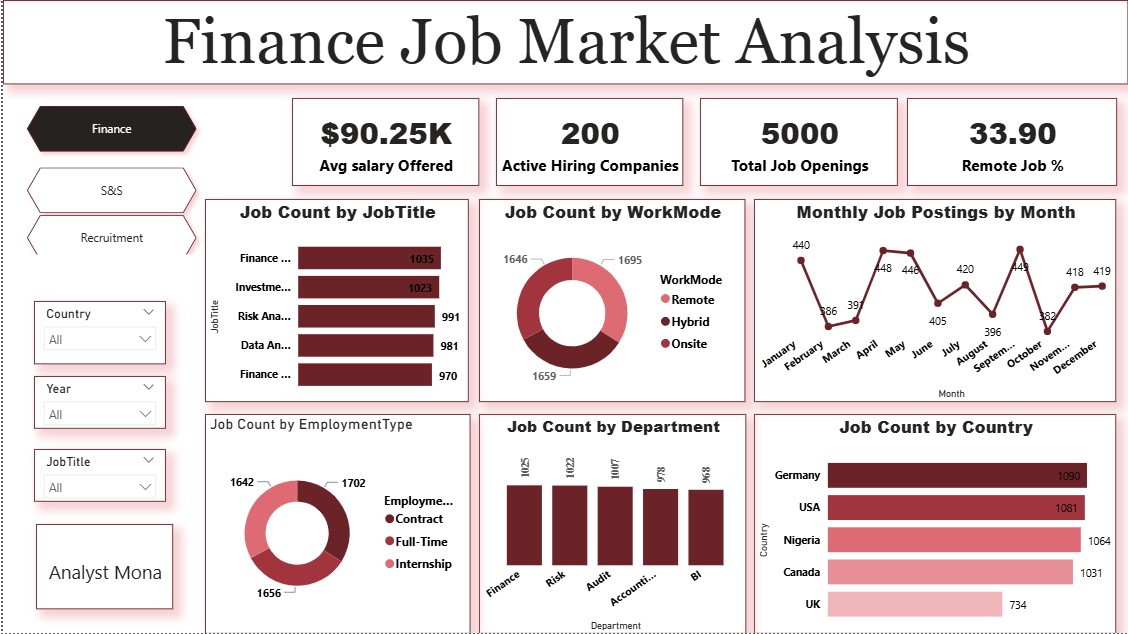
Dashboard Views Gallery (Views 1, 2 & 3)
1. Business Problem
A regional hospital network faced severe bottlenecks in emergency room throughput, unpredictable bed occupancy spikes, and fragmented clinical reporting across departments. Medical directors required a unified, 3-view Power BI suite to track patient care velocity from initial intake to discharge.
2. Project Objectives
- Build an enterprise 3-page Power BI dashboard suite integrating operational, inpatient, and emergency department datasets.
- Calculate real-time DAX measures for Average Length of Stay (ALOS), Emergency Triage Wait Velocity, and Bed Turnover Rate.
- Implement interactive department drilldowns and patient risk cohort slicers.
3. Dataset Information
Healthcare operational dataset covering 120,000+ patient encounters across 4 clinical facilities:
- Patient Demographics: Patient ID, Age, Gender, Insurance Type, Admission Type.
- Clinical Encounters: Admission Date, Discharge Date, Department, Triage Score (1-5), Attending Physician.
- Resource Metrics: Bed Occupancy Status, ER Wait Time (Minutes), Treatment Cost, Readmission Flag.
4. Tools Used
Power BI Desktop
DAX Time-Intelligence
Power Query M Engine
Healthcare Domain
5. Data Cleaning & Transformation
Key transformation steps executed in Power Query & DAX:
1. Cleansed missing discharge timestamps and standardized triage priority codes.
2. Built relational Star Schema linking Fact_Encounters to Dim_Patient, Dim_Department, and Dim_Calendar.
3. Formulated DAX Measure for Bed Occupancy Rate:
Occupancy Rate = DIVIDE(COUNTROWS(FILTER(Fact_Encounters, Fact_Encounters[Status] = "Admitted")), SUM(Dim_Department[Total_Beds]), 0)
6. Key Performance Indicators (KPIs)
120K+
Patient Encounters Analyzed
-28%
ER Wait Time Reduction
84.2%
Optimal Bed Occupancy Rate
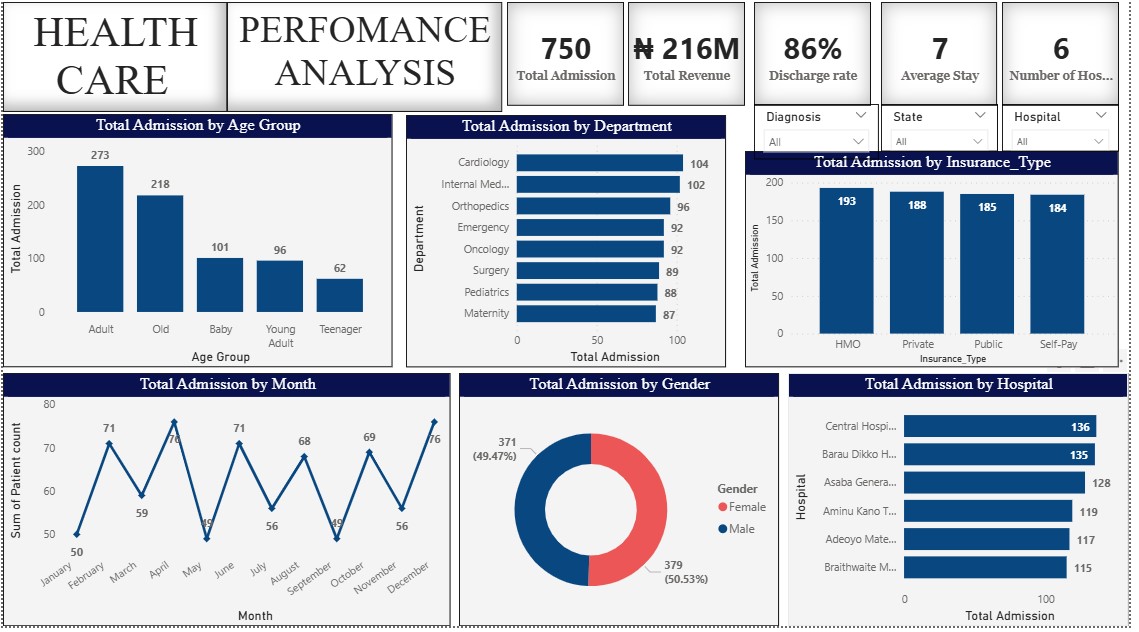
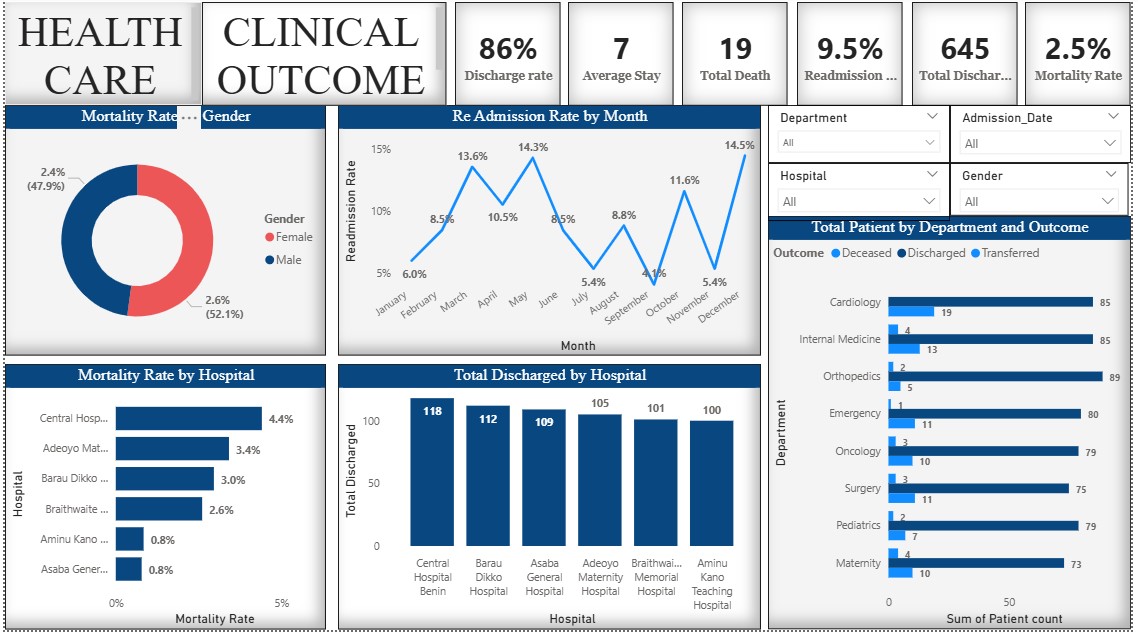
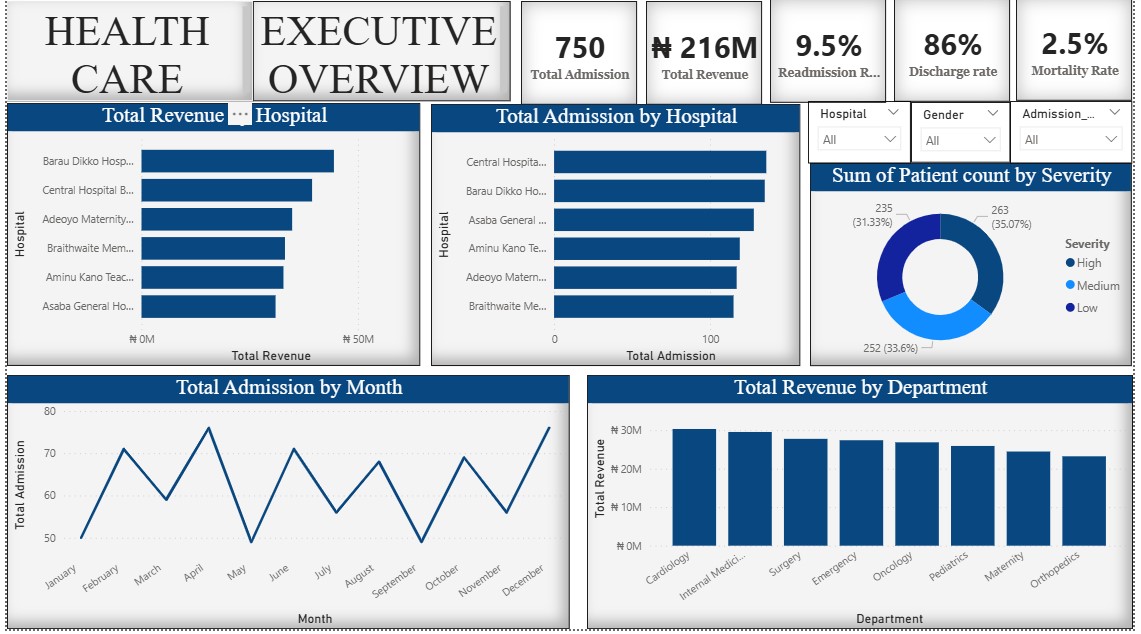
7. Dashboard Interface Showcase (Views 1, 2 & 3)
The suite consists of three interconnected dashboard pages accessible via custom navigation buttons:
View 1: Healthcare Performance
View 2: Clinical Outcome
View 3: Executive Overview
8. Strategic Clinical & Operational Insights
Finding 1: Peak ER Bottleneck Window
Analysis revealed that 42% of emergency room triage delays occurred between 2:00 PM and 6:00 PM on Mondays and Fridays due to shift overlap gaps.
9. Strategic Recommendations
- Reallocate float nursing staff to the ER department during peak 2:00 PM – 6:00 PM windows.
- Automate bed discharge notifications to environmental services to accelerate room turnaround velocity.
10. Technical Challenges
Reconciling real-time bed status updates with historical admission logs was solved by constructing a dynamic DAX snapshot table.
11. Lessons Learned
Structuring complex healthcare data into logical sub-views (Operational Overview, Patient Care, Clinical Flow) significantly increases dashboard adoption among hospital executives.
12. GitHub Repository
Open Source Power BI Healthcare Template
Inspect DAX measures and data model structure on GitHub.
13. Downloads & Resources
14. Related Analytics Case Studies